Telco 2.0™ Research
The Future Of Telecoms And How To Get There
The Future Of Telecoms And How To Get There
|
Summary: When Amazon Web Services (AWS) landed in Australia in 2012, everyone expected carnage for Australian carriers. Telstra’s Network Applications & Services division, though, is growing fast and making some interesting moves. How did Telstra do it, and what else can be learned from its successes and its latest moves into the Healthcare market? (August 2015, Cloud & Enterprise ICT Stream) |
|
![]()
![]()
Below is an extract from this 25 page Telco 2.0 Report that can be downloaded in full in PDF format by members of the Cloud & Enterprise ICT Stream here. To find out more about how to join or access this report please see here or call +44 (0) 207 247 5003.
Australia’s incumbent telco is experiencing the same disruptive forces as others, just not necessarily in the same way. Political upheaval around the National Broadband Network (NBN) project is one example. Others are the special challenges of operating in the outback, in pursuit of their universal service obligation, and in the Asian enterprise market, at the same time. Telstra’s area of operations include both some of the sparsest and some of the densest territories on earth.
Australian customers are typically as digitally-literate as those in western Europe or North America, and as likely to use big-name global Web services, while they live at the opposite end of the longest submarine cable runs in the world from those services. For many years, Telstra had something of a head start, and the cloud and data centre ecosystem was relatively undeveloped in Australia, until Amazon Web Services, Microsoft Azure, and Rackspace deployed in the space of a few months presenting a first major challenge. Yet Telstra is coping.
Between H2 2009 and H2 2014 – half-yearly reporting for H1 2015 is yet to land – top-line revenue grew 1% annually, and pre-tax profits 3%. As that suggests, margins have held up, but they have only held up. – Net margin was 16% in 2014, while EBITDA margin was 43% in 2009 and 41% in 2014, having gone as low as 37% in H2 2010. This may sound lacklustre, but it is worth pointing that Verizon typically achieves EBITDA margins in this range from its wireless operation alone, excluding the commoditised and capital-intensive landline business. Company-wide EBITDA margins in the 40s are a sound performance for a heavily regulated incumbent. Figure 1 shows sales, EBITDA and net margins, and VZW’s last three halves for comparison.
Figure 1: Telstra continues to achieve group-wide EBITDA margins like VZW’s
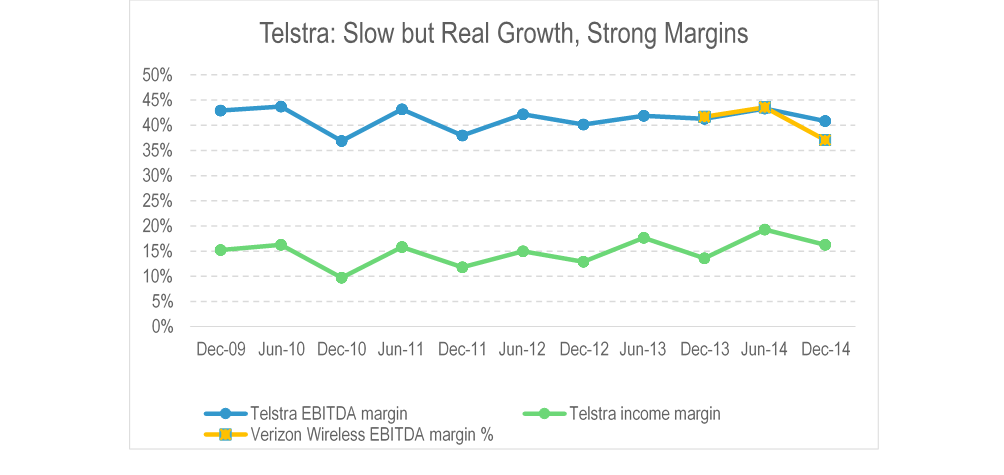
Source: STL Partners, Telstra filings
Looking at Telstra’s major operating segments, we see a familiar pattern. Fixed voice is sliding, while the mobile business has taken over as the core business. Fixed data is growing slowly, as is the global carrier operation, while enterprise fixed is declining slowly as the traditional voice element and older TDM services shrink. On the other hand, “Network Applications & Services” – Telstra’s strategic services group capturing new-wave enterprise products and the cloud – is growing strongly, and we believe that success in Unified Communications and Microsoft Office 365 underpins that growth in particular. A one-off decrease since 2009 is that CSL New World, a mobile network operator in Hong Kong, was sold at the end of 2014.
Figure 2: Mobile and cloud lead the way
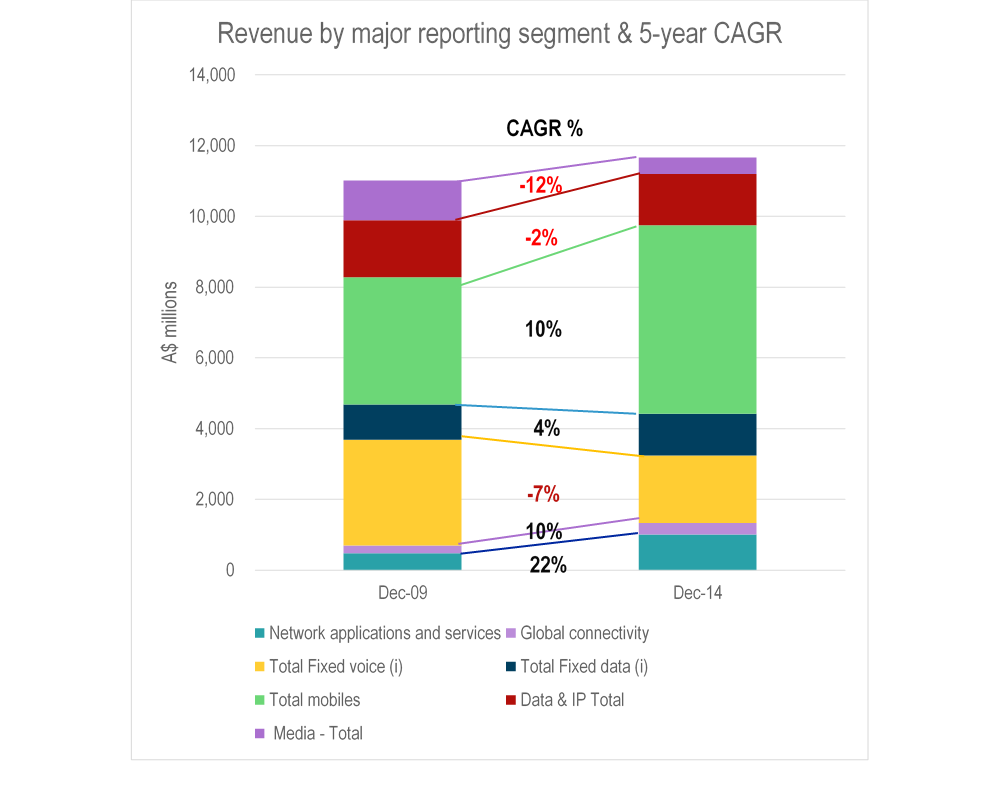
Source: STL Partners, Telstra filings
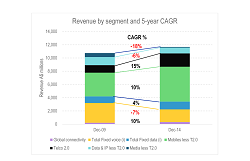
Another way of looking at this is to consider the segments in terms of their size, and growth. In Figure 2, we plot these together and also isolate the ‘Telco 2.0’ elements of Telstra from the rest. We include the enterprise IP access, Network Applications & Services, Pay-TV, IPTV, and M2M revenue lines in Telco 2.0 here, following the Telco 2.0 Transformation Index categorisations.
Figure 3: Telco 2.0 is a growing force within Telstra
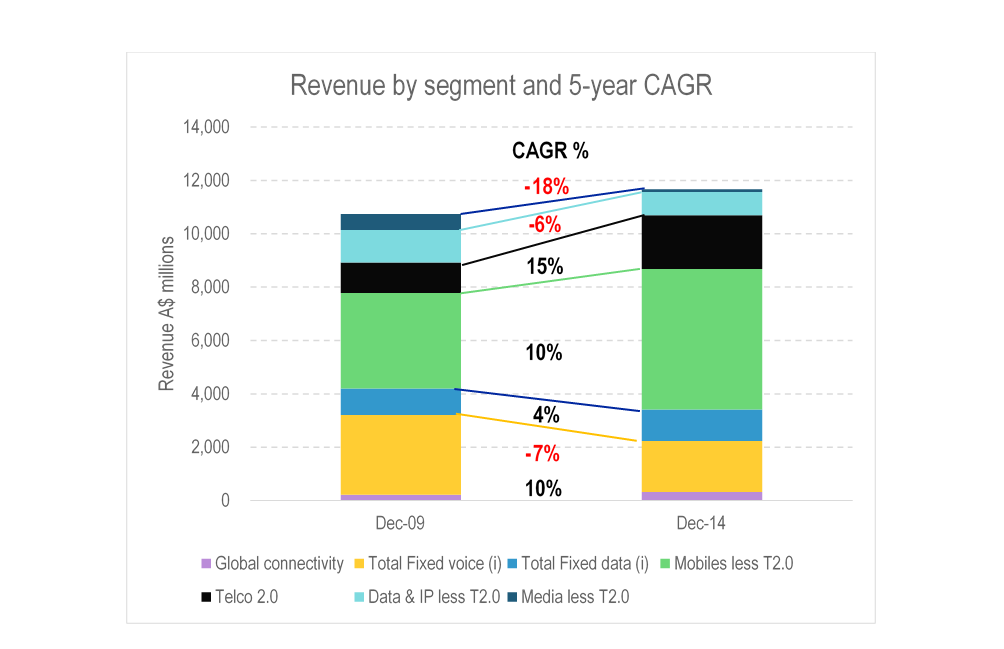
Source: STL Partners, Telstra filings
The surge of mobile and the decline of fixed voice are evident. So is the decline of the non-Telco 2.0 media businesses – essentially directories. This stands out even more so in the context of the media business unit.
Figure 4: Telstra’s media businesses, though promising, aren’t enough to replace the directories line of business
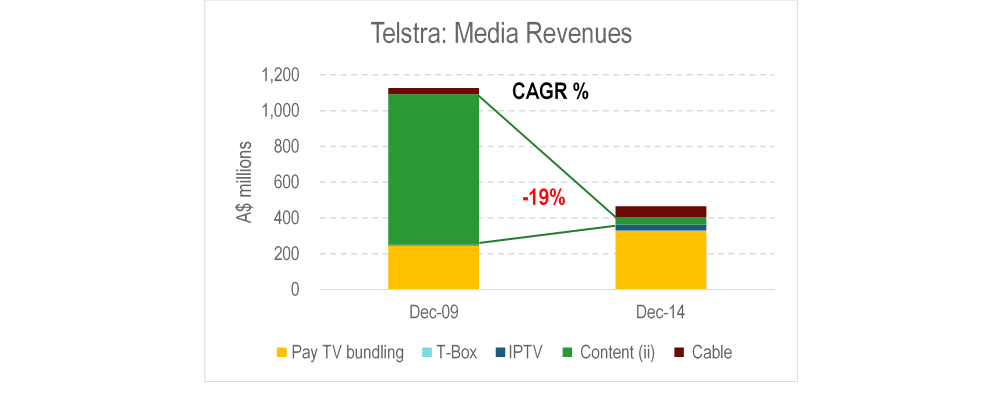
Source: STL Partners, Telstra filings
“Content” here refers to “classified and advertising”, aka the directory and White Pages business. The Telco 2.0 businesses, by contrast, are both the strongest growth area and a very significant segment in terms of revenue – the second biggest after mobile, bigger even than fixed voice, as we can see in Figure 5.
Figure 5: Telco 2.0 businesses overtook fixed voice in H2 2014
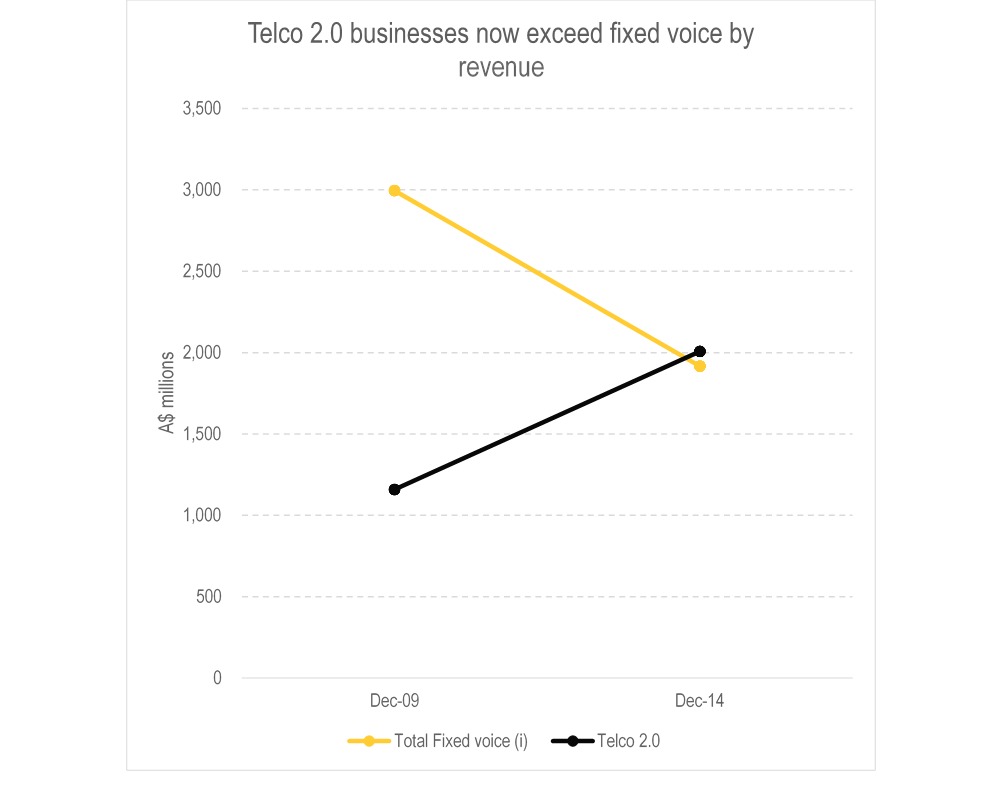
Source: STL Partners, Telstra filings
To reiterate what is in the Telco 2.0 box, we identified 5 sources of Telco 2.0 revenue at Telstra – pay-TV, IPTV, M2M, business IP access, and the cloud-focused Network Applications & Services (NA&S) sub-segment. Their performance is shown in Figure 6. NA&S is both the biggest and by far the fastest growing.
To access the rest of this 25 page Telco 2.0 Report in full, including...
...and the following report figures...
...Members of the Cloud & Enterprise ICT Stream can download the full 25 page report in PDF format here. For non-members, to find out more about how to join or access this report please see here or call +44 (0) 207 247 5003.
Technologies and industry terms referenced include: cloud, Amazon Web Services, AWS, enterprise, Telstra, Unified Communications, differentiation, digital, innovation, M2M, NFV, APAC, APCN, media, Australia, Verizon.