 This is an extract from a report by Arete Research, a Telco 2.0TM partner specalising in investment analysis. The views in this article are not intended to constitute investment advice from Telco 2.0TM or STL Partners. We are reprinting Arete's analysis to give our customers some additional insight into how some investors see the Telecoms market.
|
This report can be downloaded in full in PDF format by members of the Telco 2.0 Executive Briefing service using the links below. 'Growing the Mobile Internet' and 'Fostering Vibrant Ecosystems: Lessons from Apple' are also key session themes at our upcoming 'New Digital Economics' Brainstorms (Palo Alto, 4-7 April and London, 11-13 May). Please use the links or email [email protected] or call +44 (0) 207 247 5003 to find out more. |
In August '05 we [Arete Research] published A Billion Handsets in '07?, where we argued that the coming of low-cost ($25 BoM) handsets would open a new segment and take the market to unimaginable volumes (consensus at the time saw 6% growth to ~800m units in '07). By '07 the global handset market hit 1.2bn units, Samsung passed Motorola in volumes, and Mediatek began supplying many new entrants. Now we see the same pattern being repeated in smartphones: Western vendors staked out the first 350m units, and Apple is on track to be the #1 by value share in 1Q11. We see $80 BoM cost smartphones by YE'11, sparking rapid growth and further dramatic shifts in the mobile device landscape
The lure of the largest consumer electronics end-market in the world, the emergence of Chinese vendors with global ambitions, the lowering of barrier entries, and the value attributed to connecting wirelessly to the Internet will drive significant uptake of smartphones and tablets in '12. It is no longer crazy to talk about "A Billion Smartphones in 2013".
Table 1: Smartphone and Tablet Shipments by Region
|
|
'10 |
% of Units |
'11E |
% of Units |
'12E |
% of Units |
'13E |
% of Units |
'14E |
% of Units |
'15E |
% of Units |
|
Europe |
87m |
28% |
142m |
45% |
220m |
66% |
272m |
80% |
286m |
83% |
298m |
85% |
|
N. America |
90m |
47% |
140m |
67% |
166m |
75% |
181m |
80% |
197m |
85% |
210m |
90% |
|
Asia |
94m |
16% |
130m |
19% |
230m |
30% |
301m |
37% |
377m |
43% |
463m |
49% |
|
MEA |
20m |
8% |
34m |
11% |
98m |
26% |
151m |
38% |
213m |
50% |
268m |
60% |
|
LatAm |
26m |
13% |
38m |
18% |
85m |
34% |
177m |
67% |
203m |
74% |
219m |
78% |
|
Total |
316m |
21% |
484m |
28% |
800m |
41% |
1,083m |
53% |
1,276m |
59% |
1,458m |
65% |
|
ASPs |
$324 |
|
$304 |
|
$215 |
|
$182 |
|
$166 |
|
$155 |
|
|
Tablets |
17m |
|
57m |
|
102m |
|
150m |
|
175m |
|
218m |
|
Source: Arete Research estimates
In '10 developed market demand lifted global ASPs after relentless declines. Apple, HTC and RIM took 9% of value share at Nokia's expense (down 11% from '08 to '10). Even with incremental smartphone demand driven by emerging markets from 2H11, it is clear consumers are willing to spend more for a smartphone. This should soften historic ASP declines: we see the overall handset industry rising from $182bn in '10 to $214bn in '11 (+18%) and $223bn in '12 (+4%). Smartphone units should reach 480m in ’11 and 800m in '12. We estimate smartphones will be on a 1bn annual run rate by 4Q12.
Wireless Logic Semis Could Double. The rise of mass market smartphones will raise the semis content within device BoMs. Apps processors, connectivity and memory (mobile DRAM and flash) will rise in the mix as display prices drop. We think the $9.5bn logic semis market can rise to $18bn+ in '12. We also see steep price declines in tablets as traditional PC and mobile device ecosystems battle to control new low-cost computing platforms.
Memory Madness. We think combined DRAM and NAND demand will lead mobile device memory sales to nearly triple from ~$9bn in '10 to $24bn in '12, offsetting weak PC demand.
Telcos: Dummies No More. Developed markets operators will offer bundled tablets from mid-'11, while low-cost computing will reach emerging markets like India. Smartphones offer a vast upselling opportunity for operator dataplans.
We see the same failure of imagination around smartphone volumes that we saw and wrote about in traditional handsets: industry and financial analysts simply cannot break the habit of forecasting mid-single digit annual growth. Yet it is clear that adding touchscreens and better browsers, as well as rolling out 3G infrastructure in emerging markets significantly boosts the marginal utility of a mobile device to end consumers.
In 2010 consumers showed a willingness to pay more for devices, because they were worth more to them. Although the apps developed for emerging markets will be different from those well-known in the US and Europe, we have little doubts that the openness of smartphone platforms will allow new usage patterns there as well. The software flexibility and gradual release of more language packs for low-end smartphones only widens the addressable base for these devices. While we appreciate some people think emerging markets consumers will not want a "good enough" smartphone, we also cannot model 200-300m users jumping from sub-$100 ASPs to over $200; we think a smaller display touchscreen model with limited onboard memory would find broad mass market acceptance.
Table 2: Differing Needs
|
|
Pop. |
Pen. |
Fixed Line Broadband per 100 people |
GDP per Capita (Current US$) |
|
China |
1,332 |
60% |
6.29 |
6,890 |
|
India |
1,177 |
58% |
0.46 |
3,250 |
|
Pakistan |
178 |
58% |
0.10 |
2,680 |
|
Nigeria |
146 |
55% |
0.04 |
2,070 |
|
|
|
|
|
|
|
US |
310 |
98% |
24.02 |
45,640 |
|
UK |
61 |
138% |
28.13 |
37,230 |
|
Germany |
82 |
128% |
27.52 |
36,780 |
Source: Worldbank Data from '08 and '09, ITU
Table 2 shows how the smartphone is poised to provide the primary method of Internet access in markets where there is negligible penetration of fixed line services. And Table 3 shows how the Middle East and Africa are joining Asia as absorbing the largest share of overall device units over time, even as value share remains concentrated in N. America and Europe. The time is rapidly coming for local brands to take centre stage in these regions. Here we see names like TCL, TianYu, CoolPad, Huawei, ZTE and Micromax and others as but the tip of the iceberg. This will only increase the pressure on the old group of five traditional handset vendors (Nokia, Motorola, Samsung, LGE and SonyEricsson) that commanded ~80% market share from '00 to '07, before the rise of Apple RIM and HTC altered industry dynamics irrevocably.
Table 3: Majority of Units in Asia & MEA '09-'12E
|
|
'09 |
'10E |
yoy |
'11E |
yoy |
'12E |
Yoy |
|
Europe |
267m |
304m |
14% |
317m |
4% |
331m |
4% |
|
|
20% |
20% |
|
18% |
|
17% |
|
|
N.Am |
180m |
192m |
7% |
209m |
9% |
220m |
5% |
|
|
13% |
13% |
|
12% |
|
11% |
|
|
Asia |
526m |
596m |
13% |
675m |
13% |
760m |
13% |
|
|
39% |
39% |
|
39% |
|
39% |
|
|
MEA |
202m |
243m |
20% |
306m |
26% |
369m |
21% |
|
|
15% |
16% |
|
18% |
|
19% |
|
|
LatAm |
158m |
193m |
22% |
218m |
13% |
251m |
15% |
|
|
12% |
11% |
|
13% |
|
13% |
|
|
Global |
1.33bn |
1.53bn |
15% |
1.73bn |
13% |
1.93bn |
13% |
Source: Arete Research estimates
How do we get to an $80 BoM smartphone, which supports a $100 trade price? The bill of materials below shows the key components and what changes in low end smartphones. Bear in mind this is a device with a <3" display and limited on-board memory; that said, retail prices for 8GB microSD cards are c. $6. We think this will bring smartphones to the mass market in place of featurephones, with emerging markets consumers getting open software platforms that allow customisation via locally relevant applications.
Our estimates by region for smartphone penetration are seen in Table 1 for '10-'15. We see the industry reaching a 1bn unit run rate by 4Q12, and exceeding this in 2013. Effectively we think that half of overall global volumes will be smartphones in 2013, i.e. users will get a software upgradable device at all but the lowest price points, with the rare exception of niche voice-centric products for developed markets (for example, for older users).
Figure 1: Getting to an $80 BoM Smartphone?
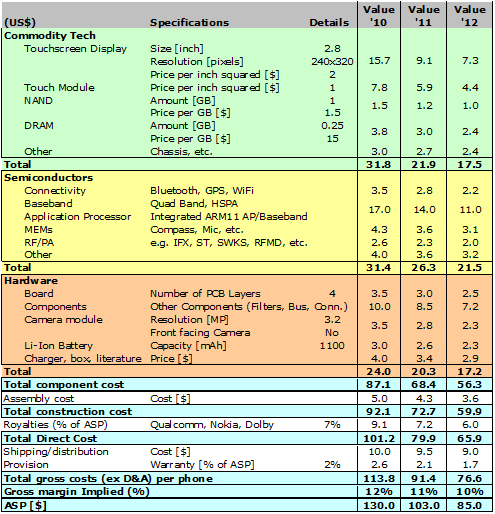
Source: Arete Research estimates
The '10 surge in developed markets smartphones drove large value share redistribution, while also sustaining global handset ASPs. Apple, RIM and HTC saw their ASPs actually increase in 2H10, while the overall industry ASPs rose 5% yoy in '10. We believe that in '11 we will see further modest ASP rises, as half of the incremental smartphone units will still come from N. America and Europe, and supply remains tight in 1H11. As emerging markets start driving growth in '12, we expect ASPs will drop, but remain above '09 levels (part of this is influenced by Apple in the mix). We reckon smartphones will constitute 84% of industry value share in '13 (based on 53% of units), up from 56% in '10 (from just 21% of units).
This does not account for the additional value that integrated handset vendors, and service providers will capture from a rising smartphone penetration, through content and other services. This dramatic shift in market value towards smartphones is shaking up what had from '00 to '07 been a cosy oligopoly in which the top five vendors consistently took ~80% of volume and value.
Figure 2: Migration to Smartphones Sustaining Industry ASPs
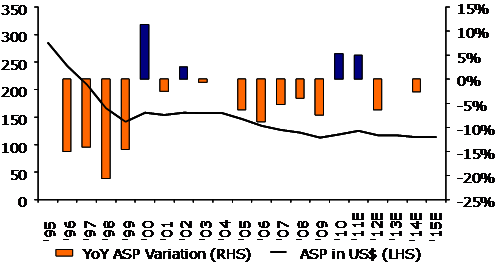
Source: Arete Research estimates
The recent announcement by Nokia to end-of-life Symbian and abandon its half of MeeGo threw the OS picture into chaos; we see Android becoming the dominant OS choice by 2012 (see Table 4), though expect a number of branches or variants on the Android kernel, as regional players and Tier One OEMs seek to differentiate smartphone offerings...
To read the Briefing in full, including in addition to the above analysis of:...and additional tables and figures...
...Members of the Telco 2.0TM Executive Briefing Subscription Service can download the full 7 page report in PDF format here. Non-Members, please see here for how to subscribe. Please email [email protected] or
call +44 (0) 207 247 5003 for further details.
There's also more on Device Strategies at our AMERICAS, EMEA and APAC Executive Brainstorms and Best Practice Live! virtual events.